Kernel · Intervention anchors · Tabulated execution · Error propagation
Predict once. Execute a million times.
Spend the flagship model only where the kernel cannot see, and carry the systematic gap between model and people into every conclusion as shared error. Every number on this page is read on held-out human experiments.
Inputs
PersonasContentConditionsJev, asked once per unique state
NucleusTreated = control + the flagship's paired effect
GPT-6 Astra, paired calls on the anchored states
AncoraeThe population, run from the table
TabulaThe gap, carried into every conclusion
Error communisPredict once (K, I). Execute a million times (T). Carry the gap into every conclusion (E).
Intervention-effect errorEpstein 2021 · 9,070 people · held out
Captured decision gain, 0.27 → 0.39SocSci210 · 37 unseen experiments
Held-out coverage of nominal 90% intervalsSampling error alone: 36%
10⁶ agents × 20 stepsFrom the state table · one laptop
15/15countries pass the content-fidelity criteria$0.023per 1k new predictions0.5–1.7%of states get a flagship call÷18effect variance with common random numbers
IMethod · the four parts of KITE Quattuor partes
A decision model as the behavioral kernel. The flagship only where the kernel is blind.
KITE is four letters and a kite drawn with compass and straightedge: the circles about K and T meet at E and I. Each letter is one part of the method, and each part has one measured fact.
-
KKernel
Ask each unique state once
A decision model that outputs calibrated probabilities and never generates text (TypeSafe Jev) is the behavioral kernel of the simulation: each unique state is asked once.
Epstein: 73,600 predictions, $1.60 -
IIntervention anchors
Spend the flagship where the kernel is blind
A flagship LLM estimates intervention effects only on sparse paired anchors; the kernel's treated distribution is tilted to the kernel's control mean plus the flagship's paired effect.
1,080 anchors = 1.7% of states -
TTabulated execution
Run the whole population from the table
Predict once, execute a million times: the kernel's cost is in prediction, not in execution.
10⁶ agents × 20 steps = 0.90 s -
EError propagation
Carry the systematic gap into every conclusion
The systematic gap between model and people enters every conclusion as shared error. Every number is read on held-out human experiments.
Coverage of nominal 90% intervals: 36% → 96%
Act IResults · three held-out experiments Actus primus
Results
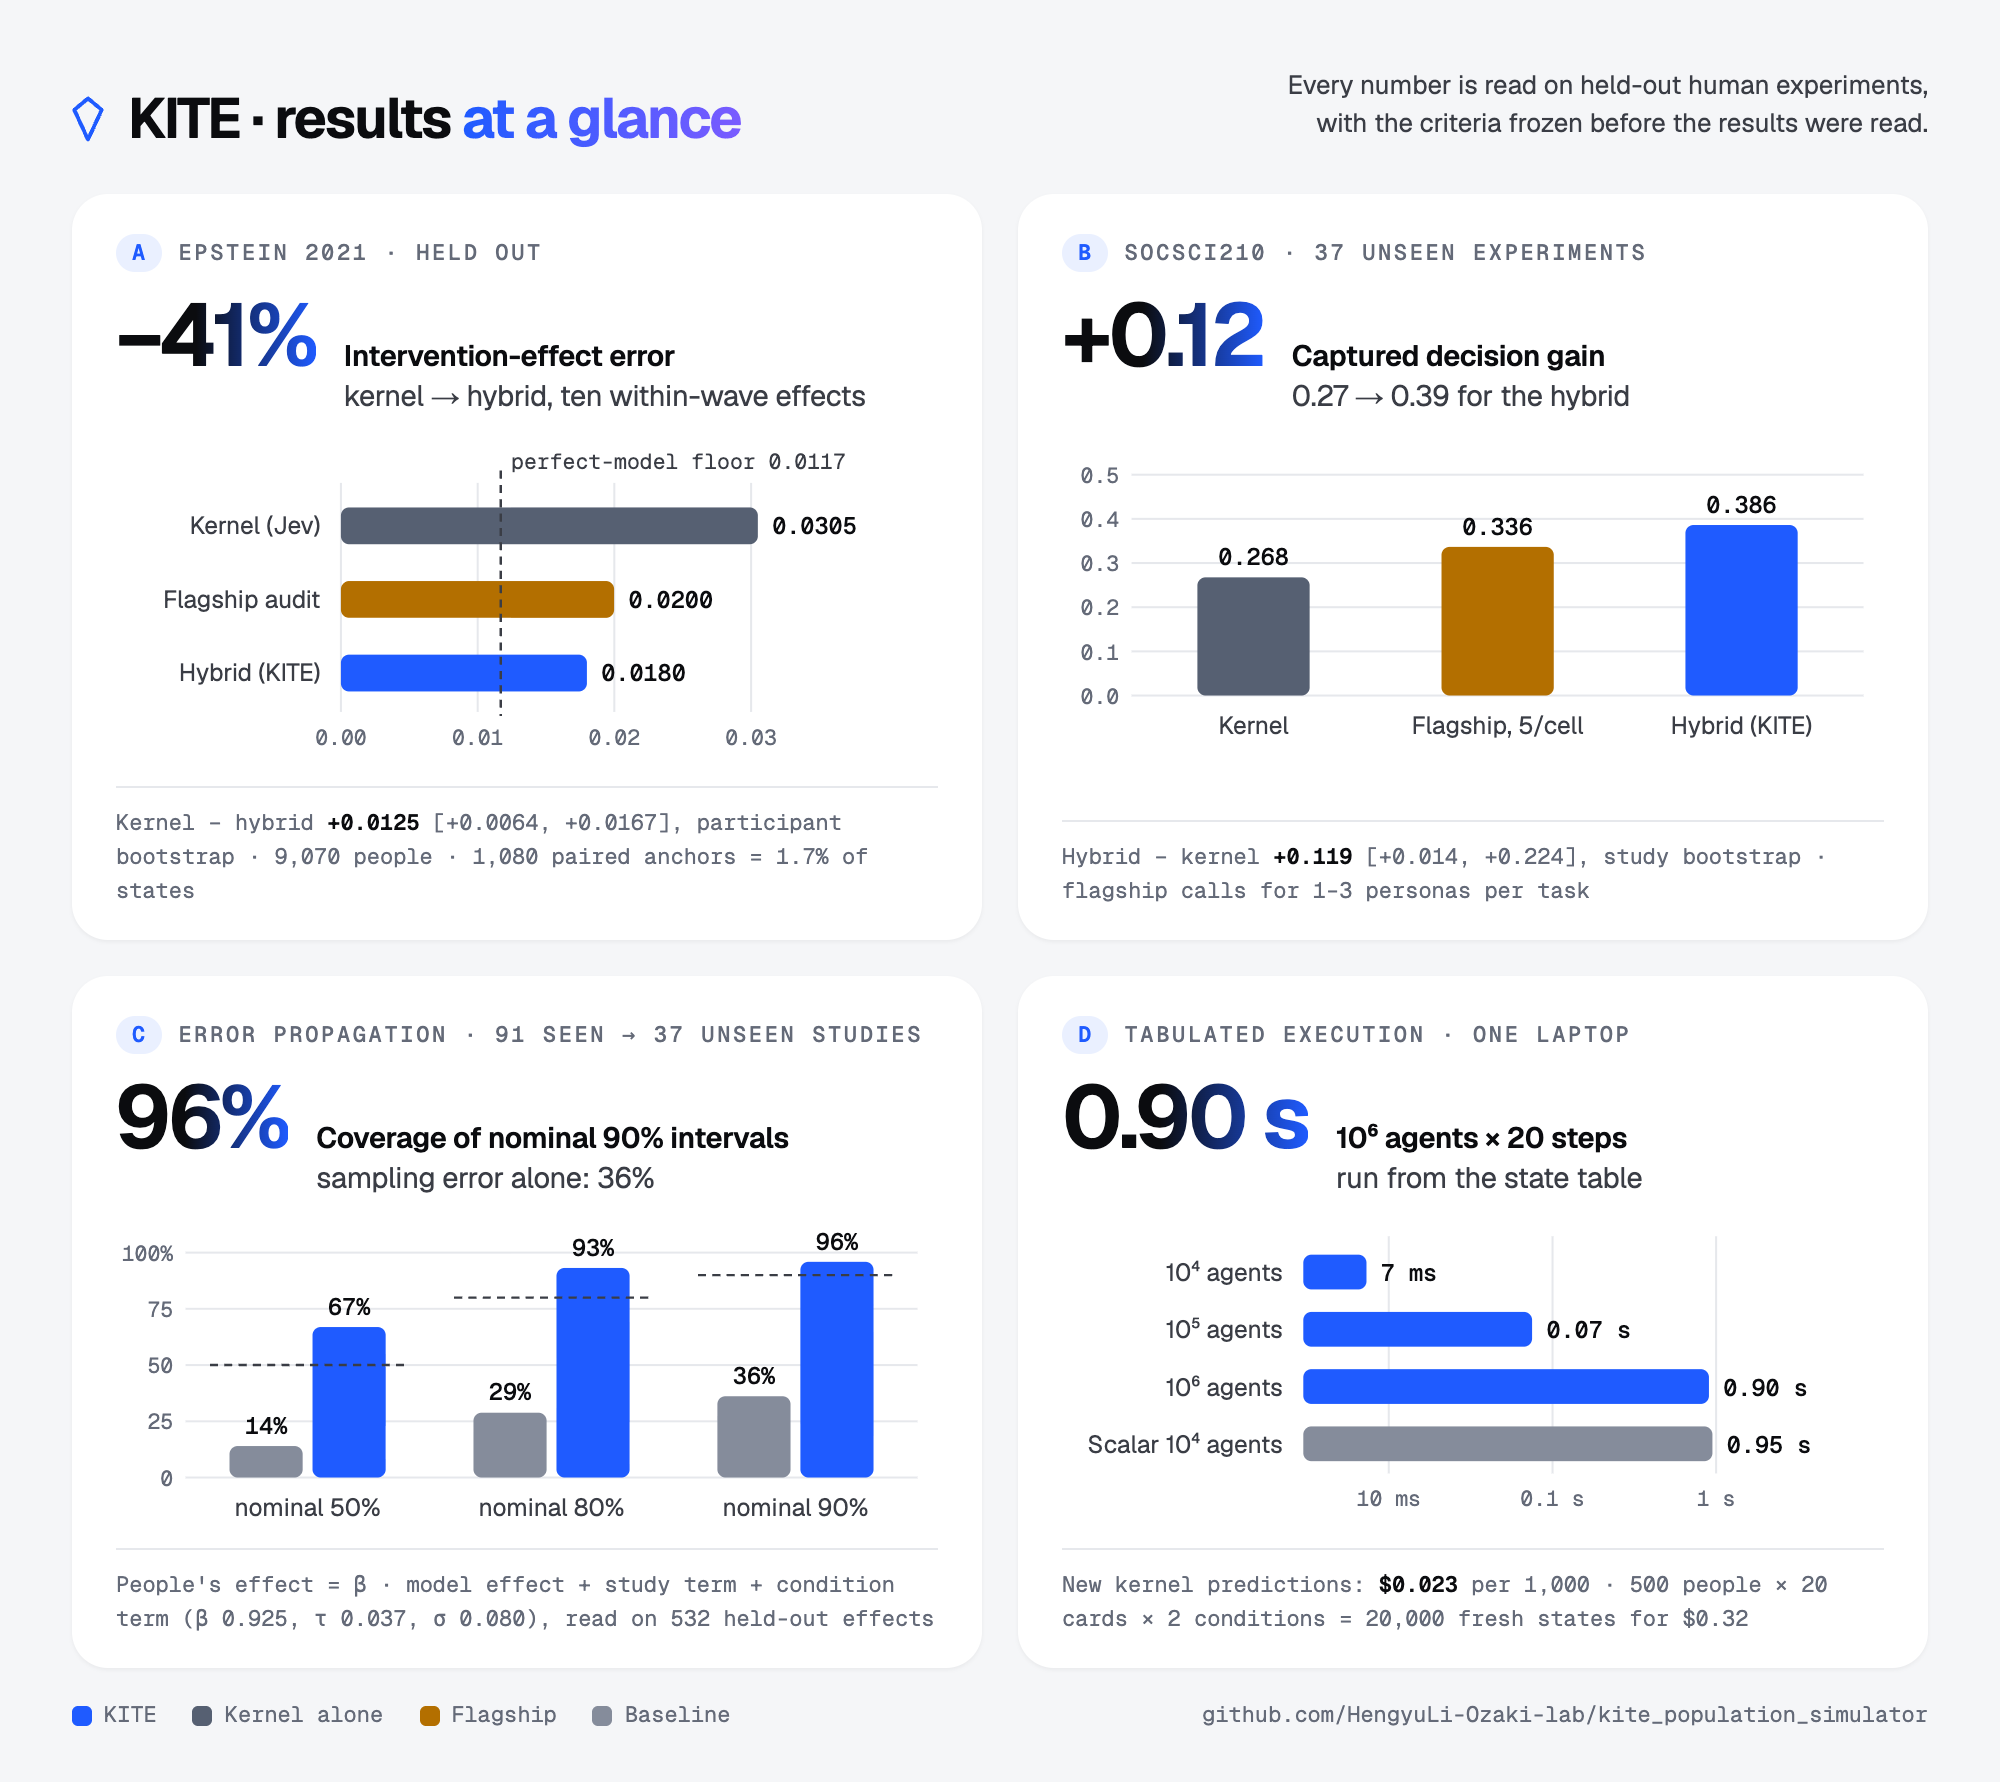
Effect error −41%. Decision gain +0.12. Coverage 36% → 96%.
Every criterion was committed before any result was read, and each test ran once. Every number is read on held-out human experiments.
KITE · results at a glance
AEpstein 2021 · held out
Intervention-effect errorkernel → hybrid, ten within-wave effects
Kernel − hybrid +0.0125 [+0.0064, +0.0167], participant bootstrap · 9,070 people · 1,080 paired anchors = 1.7% of states
BSocSci210 · 37 unseen experiments
Captured decision gain0.27 → 0.39 for the hybrid
Hybrid − kernel +0.119 [+0.014, +0.224], study bootstrap · flagship calls for 1–3 personas per task
CError propagation · 91 seen → 37 unseen studies
Coverage of nominal 90% intervalssampling error alone: 36%
People's effect = β · model effect + study term + condition term (β 0.925, τ 0.037, σ 0.080), read on 532 held-out effects
DTabulated execution · one laptop
10⁶ agents × 20 stepsrun from the state table
New kernel predictions: $0.023 per 1,000 · 500 people × 20 cards × 2 conditions = 20,000 fresh states for $0.32
The same figure as PNG and PDF; the paper is arXiv:2609.27535.
IIHeld outSparse flagship calibration · Epstein et al. 2021 Calibratio
1,080 paired anchors, 1.7% of states, cut the kernel's intervention-effect error by 41%
9,070 participants, five waves, eight accuracy-prompt interventions, each wave with its own control. The criteria were committed before any result was read. The kernel predicted every persona × card × condition state once (73,600 predictions, $1.60); the flagship made paired predictions only for twelve states in each of six cells per wave, under the control and under every treatment. The kernel's treated distribution is tilted to the kernel's control mean plus the flagship's paired effect: a replacement, not an addition.
Ten within-wave effects: people, kernel, hybrid, flagship audit
Plate II·1Horizontal axis: change in discernment (true-card minus false-card sharing) against the wave's control. The kernel over-reacts to norm messages (in wave 3 it predicted people's worst condition as the best); the hybrid pulls the ten effects back into line
Spend compute on correction, not on sample size
Plate II·2Raising the simulated people per wave from 10 to 200 leaves the kernel's error where it was; the same 1,080 anchors cut it by 41% already at 10 people per wave
Better than the calibrated parents
Plate II·3Shrink each system's effects by a slope fitted on the other four waves, then read the held-out wave. The kernel's effects are unrelated or opposite to people's, so shrinking cannot rescue them; the hybrid reaches 0.018, the same order as the human experiment's own sampling noise
IIIHeld outPaired anchors · SocSci210 · 37 unseen experiments Ancorae
Paired flagship calls for one to three personas per task, 0.5–1.5% of population states, lift decision gain from 0.27 to 0.39
Jev's native benchmark: 210 TESS survey experiments. The kernel predicts every respondent in the test set (136,901 predictions, $4.53); the flagship predicts only the first three respondents per task in hash order, under every condition (2,082 predictions). k, the slopes and the endpoints were set on the 91 seen studies and frozen, and the test set ran once. Captured gain is the share of the people's effect a decision-maker gets by picking the highest or lowest condition from the simulation (the G-A decision-value measure).
Decision value: the kernel, the flagship's own 5-per-cell run, and the hybrid at k = 1 / 2 / 3
Plate III·1Study-bootstrap 95% intervals. The hybrid's captured-gain difference over the kernel is +0.119 [+0.014, +0.224] (k = 1 already reaches +0.114); the flagship's own run gets only +0.069 (its interval includes 0)
When to trust it: accurate where they agree, and whom to follow where they differ
Plate III·2304 reliable contrasts. The kernel and the hybrid rank 79% of them the same way, with accuracy 0.74; where they differ the hybrid is right 59% of the time and the kernel 41%, while the unpaired flagship run and the kernel split evenly when they disagree
Primary endpoint (frozen): the population moves toward the flagship
Plate III·3Correlation of the conditions' effects with the flagship run's: kernel 0.61 → hybrid 0.71, gain +0.10 [+0.003, +0.29]. A pass, and a narrow one: the lower bound is only +0.003
IVHeld outDiscrepancy propagation · fitted on 91 studies, tested on 37 Error communis
The gap between model and people is far larger than Monte Carlo noise; carried into the intervals, it lifts coverage from 36% to 96%
People's effect = β × model effect + a shared study-level term + a condition-level term. The three parameters are fitted by maximum likelihood on the seen studies (with the people's sampling covariance); on 37 unseen studies we read how many human effects the nominal intervals cover. Intervals with only the people's sampling error are false precision: a nominal 90% covers just 36%.
Held-out coverage: nominal vs achieved
Plate IV·1532 condition effects. Intervals with the discrepancy model run conservative (the seen studies were screened for reliable contrasts); fitting on the 20 unscreened development studies falls short; sampling error alone is far too narrow
Simulated people only shrink the Monte Carlo interval
Plate IV·2From 5 to 200 people per cell, the sampling SD of the predicted effect falls from 0.024 to 0; the shared discrepancy √(τ² + σ²) = 0.088 does not move
Homo mensura.People are the measure of all things: every number here is read on held-out human experiments.
After Protagoras
Act IIScale · predict once, execute a million times Actus secundus
Scale
20,000 fresh states for $0.32. A million agents from the table in 0.9 s.
Then put the state table on the wind-tunnel bench: drag the population size, switch on the anchor correction, and see which of the two moves the conclusion.
VMeasuredScale · 20,000 fresh states and a million agents Multitudo
Predict once, execute a million times: the kernel's cost is in prediction, not in execution
Five hundred Epstein participants never predicted before × 20 cards × two conditions = 20,000 fresh states, run for 15 minutes against the rate limit for $0.32. From the resulting state table, a million agents each make 20 decisions: 0.9 s on one laptop. 29% of the "fresh" states were old ones: identical demographic profiles give identical persona text, so the same card under the same condition need not be asked again.
Executing from the table: 10⁴ → 10⁶ agents, 20 steps each
Plate V·1Vectorised tier (SplitMix64 event keys + inverse CDF) and scalar tier (blake2b, agent by agent). Log vertical axis
Live throughput
Plate V·2Common random numbers: variance ÷ 18
Plate V·310⁴ agents, 100 seeds: the SD of the treatment effect
VIInteractiveWind-tunnel bench · where your compute goes Cuniculus venti
Put wave 3's 200 personas in the tunnel: more people only narrow the Monte Carlo band; anchors move the conclusion
The state table comes from Epstein wave 3 (200 personas × 20 cards × 4 conditions, the kernel's predictions). Control is on the left, your intervention on the right, and each agent uses the same event-keyed random numbers on both sides (common random numbers). Drag the population size: the Monte Carlo band narrows as 1/√N, while D2's discrepancy band does not move. Switch on the D1 anchor correction to see the 1,080 anchors already paid for rewrite this population's intervention effect, without one more flagship call.
The bench: control vs intervention, one set of random numbers
Plate VI·1Act IIIWhy anchors · what the kernel sees and what it misses Actus tertius
Why anchors
It ranks headlines and situations well. It often misses which way an intervention pushes.
These diagnostics came before KITE. They show where the kernel is reliable and where its blind spot lies, and the sparse anchors are built for that blind spot.
VIIL1A methodological finding Tabula
The standard leaderboard's champion is a predictor that is useless for simulation
SocSci210's standard metric only asks whether each experimental cell's answer distribution looks like people's. Pooling people's answers across a study's experimental conditions as the prediction, a predictor that does not even know the condition changed, beats every published model on this metric. Switch to the two-dimensional view, which adds the axis "does the prediction move when the situation changes", and the champion drops to the floor.
The leaderboard's champion does not know the condition changed
Plate VII·1Horizontal: how much the distribution distance improves on a uniform guess (normalised by each side's uniform baseline, so published numbers can sit together). Vertical: the correlation, after centring within task, between how predictions and how people move across experimental conditions. Published models did not report this axis.
VIIIValidity ladder Scala
Every rung sits on a scale from null model to human reference
The needle's position is how much of the gap from chance to the human reference the model closes. The dashed line is the 95th percentile of a permutation null: only past it is a result more than luck.
From marginal distributions to individuals: how much each rung closes
Plate VIII·1IXL2What the wind tunnel is for Usus
Picking one option among candidates: worth about 40% of a half-sample human pilot
A wind tunnel is not asked to reproduce flight, only to get the direction and ranking of design changes right. We test on the test set's 133 multi-condition tasks and 304 reliable contrasts: how much gain does picking a condition from the simulation capture? The reference is a small experiment on half the respondents, judged by the other half.
The bigger the effect, the easier the direction, but a human pilot improves far faster
Plate IX·1Agreement with the judging half's direction, binned by effect size in the judging data
More money does not buy accuracy
Plate IX·2From 5 to 200 simulated people per cell, sign accuracy does not change: the limit is the kernel's systematic error, not sampling noise
Task by task: did the model pick the people's best condition?
Plate IX·3XL2Misinformation · Arechar et al. 2023 Rumor
It ranks which headlines are believed and shared very well; the accuracy prompt it cannot see
US calibration set: 2,118 respondents, 23 COVID headlines (15 false, 8 true), 21,722 predictions. The model reads exactly what respondents read, in the same order. Headlines appear as topic tags. After the criteria were frozen, the other 15 countries and the other half of the headlines ran once as held-out parts (panel below); the last panel is a flagship-tier LLM on the same respondents, and it does see the prompt's direction.
Headline level: the model's and people's mean ratings
Plate X·1Each dot is one headline's mean rating (1–6) in that condition. The dashed line is model = people.
It can tell true from false, but does not use it when sharing
Plate X·2How much higher true news scores than false news (1–6 scale). The gap is large when the question is "is it accurate" and small when it is "would you share it"; the model reproduces the drop
How much sharing changes after the accuracy prompt
Plate X·3Relative to the share-only condition. Reminded people share less false news; the model instead shares slightly more. Even with the mechanism written into its context (†), it moves only about a sixth as much as people do
Held out: 15 countries; respondents in 9 read a translation, while the model always reads English
Plate X·4Criteria committed before any held-out data was read, and run once. Left: headline-level agreement; right: the accuracy prompt's effect on sharing discernment. Both panels list the countries in the same order
Flagship-tier comparison: same respondents, and GPT-6 Astra sees the direction
Plate X·515 countries × new headlines, 30 people per country and condition (nested within Jev's 100); both models read identical content. The criteria are the ones frozen for Jev, and the design was committed before the flagship's first prediction
The change in sharing, split into the true and false channels
Relative to the share-only condition (1–6 scale, countries weighted equally). Discernment effect = change for true news − change for false news
Country by country: each segment points from Jev to Astra
Ink marks the people's effect and its 95% interval. Given the same condition assignment, the two models react alike to the same personas, so their country numbers correlate strongly. With 30 people per cell the country level cannot be tested, and neither model tracks people's country differences
Festina lente.Make haste slowly: the criteria are frozen first and the results read after; every held-out test runs once.
Motto of the Aldine press
Act IVFrontier · individuals and spread Actus quartus
Frontier
Memory gives structure between questions. A spread sketch shows what a blind spot costs.
These two chapters are the boundary: individuals (L3) can be partly validated, and spread (L4) is only a projection under stated assumptions.
XIL3Individuals Persona
Building a person: memory gives which questions move together, not a lifetime's temperament
Demographic personas carry almost no individual information for any method (cross-validated r = 0.013), so a simulated population that answers independently has no link from one question to the next. Letting each simulated respondent remember its last 3 answers, then applying a rank-preserving marginal correction per cell, reproduced the structure of the between-question correlations in all 6 new studies. But the structure is local: between distant questions, agreement is only about 40% of people's.
Between-question correlations: people and simulation
Plate XI·1How the correlation decays with distance between questions
Horizontal: how many questions apart two items are in the questionnaire. Up close the simulation sticks together more than people do; far apart, too little
XIIL4Wind-tunnel simulation · a sketch Adumbratio
Three wind tunnels, one false headline: which one recommends the accuracy prompt?
Plug the effects measured on the calibration set into a spread network. Control and intervention use the same stream of random numbers, so any difference you see comes from the intervention alone. The first tunnel uses the effect measured in the human experiment, the second Jev's prediction, the third the flagship-tier GPT-6 Astra's; all three come from the same part of the 15-country held-out set. Near the tipping point the network amplifies a small individual effect, and the point the model cannot see is exactly the point that decides.
One network, three sets of individual effects
Plate XII·1Final number of sharers across 400 paired runs
Grey: control; coloured line: intervention. Paired comparison under the same random numbers; square-root vertical scale. The rings show one run that spread in the control group